Understanding the Print Outliers report
Learn how to use the Print Outliers report.
- From the Analytics web portal, clickCheck out the new Beta Analytics 2.0 here.Accept the acknowledgement terms.You have to accept the acknowledgement terms only when you are accessing Analytics 2.0 for the first time.Select the organization, and then clickNext.
- You must have the Print Management administrator role to access the Print Outlier report. If you are in a partner set‑up, then you can select a child organization.
- You can set the time period for which you need the report. The maximum range is a one-year window within the prior two years.
- By default, the outlier report shows top 30 departments or users in the relevant report. You can disable theShow Only Top 30option to view all the departments or users in the reports.
- If there are users not associated with any departments, then they are grouped under alias. The group is termed as No department associated.
- The reports are now categorized into Cloud Print Management Reports, Cloud Fleet Management Reports, and Cloud Solution Center Reports.
From the report menu, selectPrint Outliers (beta).On theCloud Print Management Reports - Outliers (beta)window, do the following:- In theReport Optionssection, selectShow deleted usersto include deleted users in the report.From theReporting Periodmenu, select the time period for the report.
- ClickGenerate Report
- Total—Shows the total number of print impressions.
- Color—Shows the total number of color print impressions.
- One Sided, Multi Sheet—Shows the total number of one‑sided print impressions on two or more sheets. This data does not include single‑page print impressions.
- You can search for a particular user by typing the name of the user in the Search Users text field.
- You can view the top users in an organization and a department.
- You can view each department in the list to view department level data. For instance, once you navigate to the department summary page, you can see the top users in that particular department.
- You can click each username to view the user summary page. You can navigate back to the organization‑level data from the menu itself.
Key performance indicators reportOn the top-left part of the screen, from the reports menu, you can select other reports to which you have access.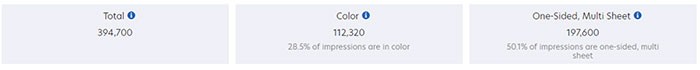 The key performance indicators for print usage include the following:Tree map report
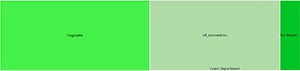 The tree map shows the distribution of print impressions across departments under a particular organization or child organization. On clicking each of the departments in the tree map report, you can get the outlier details of that particular department. In the department outlier, on clicking each of the users, you can get the outlier details of a particular user.Print history
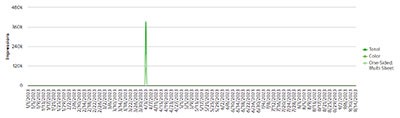 The graph shows the trend in total, colored, and one‑sided multi‑sheet print impressions across the organization.Top departments in an organization
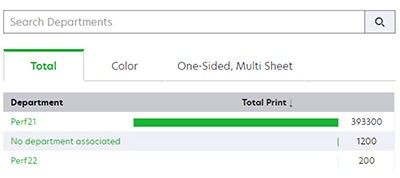 The section shows the list of departments and their corresponding print impressions. You can use the Total, Color, and One Sided, Multi Sheet tabs to view the respective print impressions in each category.You can search for a particular department by typing the name of the department in the Search Departments text field.Top users in an organization
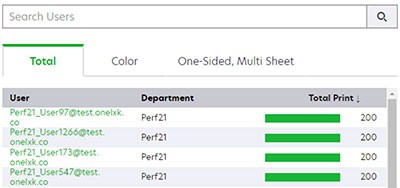 The section shows the list of users and their corresponding print impressions. You can use the Total, Color, and One Sided, Multi Sheet tabs to view the respective print impressions in each category.